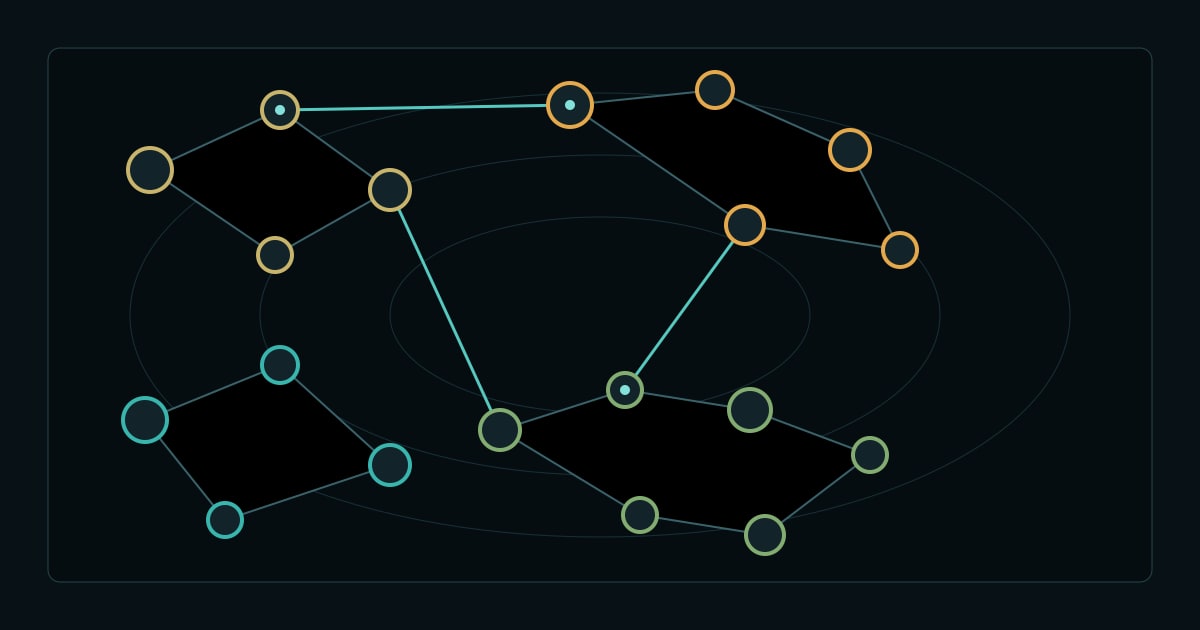
How to read a commodity relationship graph
A useful network explains what each line means, how far an inference travels, and where the source evidence ends.
A network view can make a complicated market legible. Attractive lines can also conceal weak reasoning, so every node and connection needs a type that readers can inspect.
Start with the node type
CommodityNode uses separate node types for commodities, benchmarks, physical assets, routes, companies, industries, countries, and events. The distinction prevents a common visual error: treating everything connected to “copper” as if it were the same kind of exposure.
Mines describe physical production. Benchmarks describe prices; refiners and end-use industries occupy different stages of the supply chain. Futures contracts represent traded exposure rather than physical shipments.
Then read the edge
Every connection should answer a verb:
- produces
- processes
- ships through
- owns or operates
- consumes
- can substitute for
- tracks as a market proxy
- moved with during a stated window
If a line cannot be named, it should not be drawn.
Direct and inferred paths
A direct path has one edge: an asset produces a commodity, or a route carries a documented flow. An inferred path combines several edges. For example:
event → port constraint → export delay → regional benchmark exposure
The longer path may be useful, but it should carry lower confidence and expose each intermediate step. The graph documents the reasoning and stops short of predicting the final market move.
Evidence attached to each edge should retain its source and reporting period. The W3C Data on the Web Best Practices provides the broader provenance standard; CommodityNode applies it with the two-timestamp rule for market data.
Why the mobile view is a list
On a narrow screen, a dense force-directed graph becomes difficult to operate and impossible to compare. CommodityNode therefore presents ranked paths as a list by default on mobile. Each row preserves the same nodes, edge types, evidence, and confidence as the visual view.
The ranked list carries the complete model. The canvas remains an optional way to explore the same evidence.
Frequently Asked Questions
Does a connection imply causation?
No. The edge label states the documented relationship. A correlation edge describes co-movement during a stated window; it does not become a physical or causal link.
Why does confidence fall across longer paths?
Each additional edge introduces another assumption, source, and reporting delay. CommodityNode exposes those steps and discounts the combined path instead of presenting a multi-hop inference as a direct fact.
Can the table and graph disagree?
They should not. Both views use the same nodes, edges, evidence, and confidence. The table is the accessible reference; the graph is a spatial way to explore it.
